
This is an exploratory analysis of Instacart data to derive insights and suggest strategies to improve marketing.
This analysis will help ensure Instacart targets the right customer profiles with the appropriate products in applicable marketing campaigns and impact the proper timing for various types of marketing.
Key Questions:
- What are the busiest days and times?
- Do ordering habits vary by region?
- What customer segments are suggested by the data?

Project Overview
Data
•The Instacart Online Grocery Shopping Dataset 2017, Accessed via Kaggle on 9/26/2023.
•Data sets include demographic information on customers, and detailed information on departments, products, and orders.
•Customer and prices data were fabricated for the purpose of this exercise.
Tools Used

Libraries Used

Analysis
In Python:
•Handled missing values and standardized data formats to ensure data cleanliness and uniformity.
•Implemented data subset operations based on specific criteria to extract relevant subsets of data.
•Conducted dataset integration with merge operations to consolidate information from multiple sources.
•Applied data grouping methodologies and aggregated variables using statistical functions to summarize and analyze patterns within distinct data subsets.
•Derived new variables by applying mathematical transformations to enhance the dataset’s predictive capabilities.
•Generated data visualizations using statistical plotting libraries to convey insights graphically, facilitating the interpretation and communication of complex patterns and trends in the data.
Project Links
Project Data Analysis
Wrangling, Cleaning, & Merging
1
First, data wrangling was performed, including renaming columns and removing unnecessary columns. Also, a data dictionary for the departments was created.
2
Consistency checks were performed on each data set, such as excluding certain missing values, dropping duplicates, looking for mixed data types, and adjusting data types.
3
Then, data sets were merged into one comprehensive data set.


Grouping, Aggregating, & Deriving New Variables
4
Next, data was grouped and aggregated in various ways to help with the analysis.
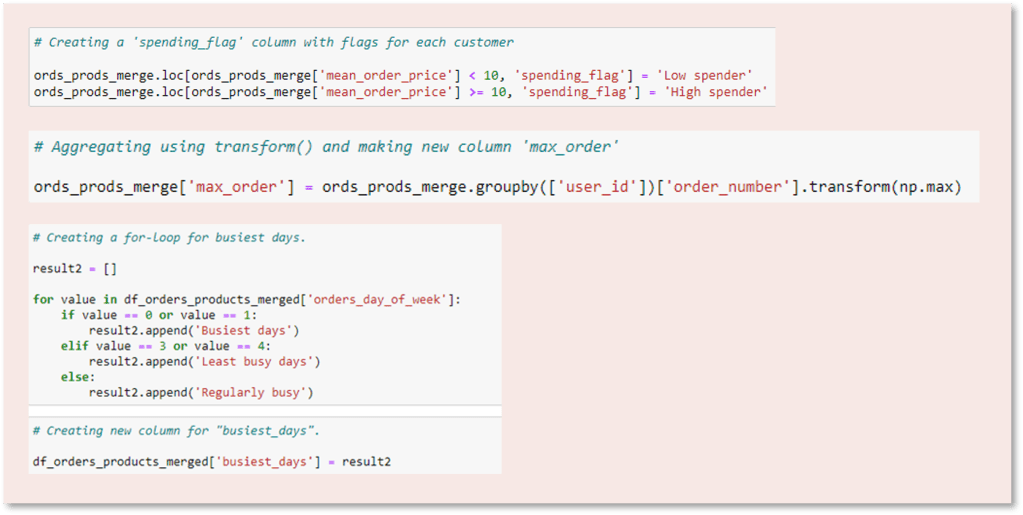
5
New variables were derived.
Ordering Trends
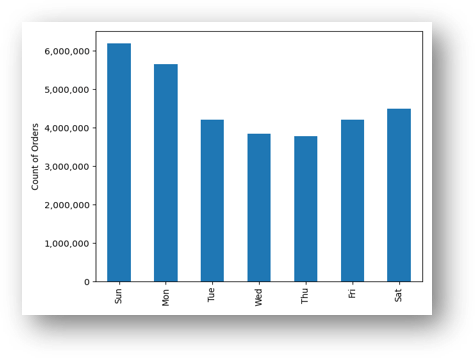
The busiest days per week with the most orders are Sundays and Mondays.
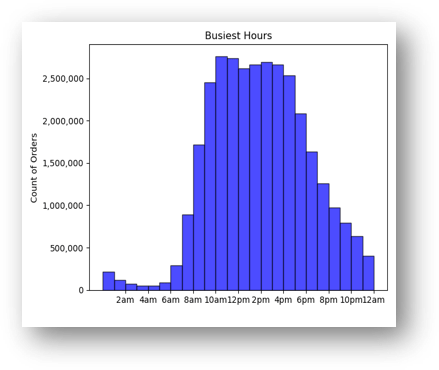
The busiest hours per day with the most orders are between 9 a.m. and 5 p.m., with the highest peak between 10 a.m. and 12 p.m.
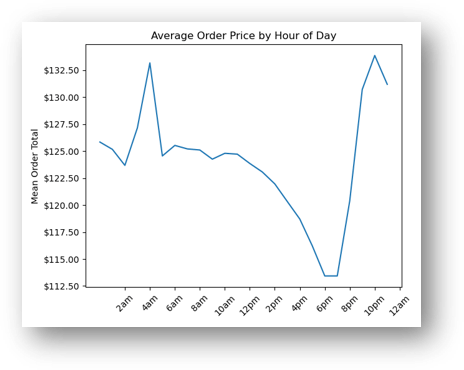
People spend the most money per order averaged between 9 p.m. and 8 a.m. This is the opposite from order volume. There is a large dip in the amount of money people spend from about 2 to 8 p.m. With the biggest dip from 6 to 7 p.m.
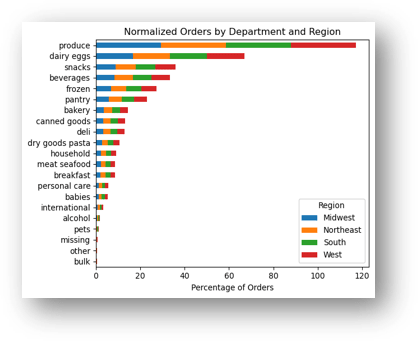
Top 5 departments for order frequency:
produce, dairy/eggs, snacks, beverages, frozen
We can see that customers in one region of the US do not order significantly more or less in any department than customers in other regions.
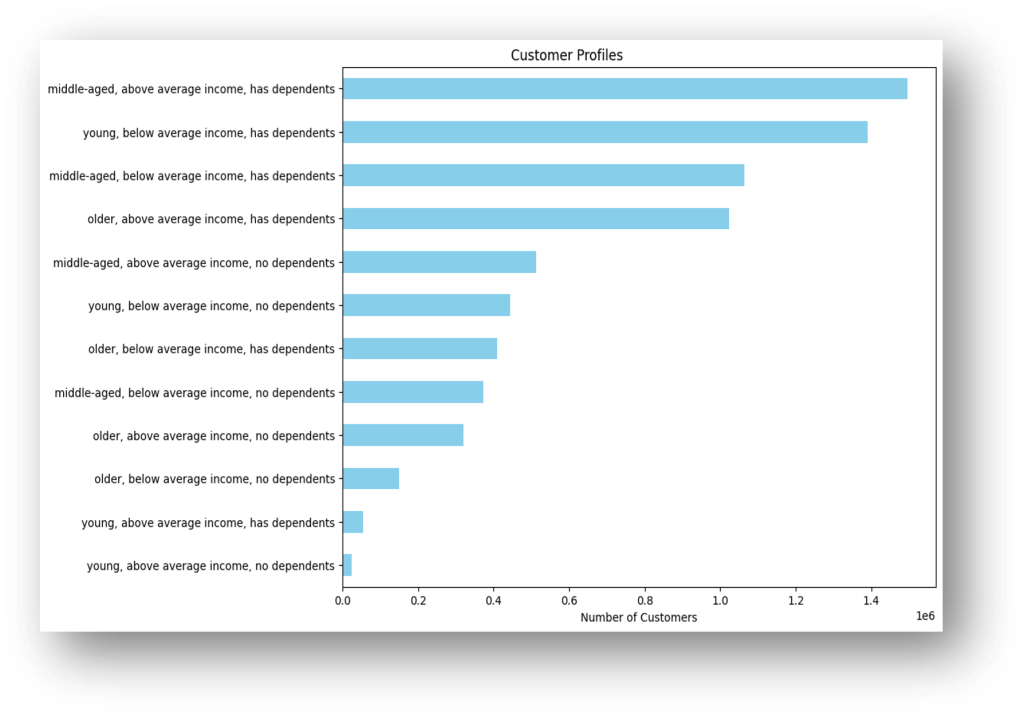
We can see that the largest customer demographic is “middle-aged, above-average income, has dependents.” And we can see that “young, above-average income,” regardless of dependents is our smallest demographic.
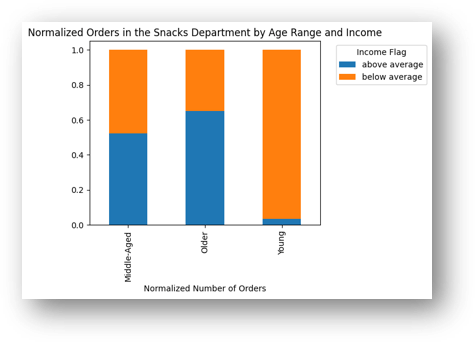
From this we can see that above-average-income young people are the least likely to order from the snacks department. A chart for the alcohol department shows a similar distribution there as well.
Recommendations
- Coordinate ads with times of highest order volume (9am-5pm).
- Push more ads on Saturday evenings and Sunday mornings as people are planning their grocery needs for the week.
- Advertise higher priced items during overnight hours when people are more likely to make impulse purchases.
- Instacart appeals most to middle-aged, above-average-income customers who have dependents, and young, below-average-income customers who also have dependents. Marketing should focus on these demographics.
- Market to younger people with above-average incomes to reach farther into that untapped demographic.
