
It is helpful for researchers and governmental policymakers to understand the distribution of wealth among billionaires and its implications for economic policies, taxation, and wealth distribution. Policymakers often seek to balance the potential benefits of wealth accumulation with the need to address inequality and ensure inclusive economic growth.
Key Questions:
- Where are billionaires most concentrated in the world?
- What factor most correlates to the number of billionaires in a country?
- How are billionaires distributed according to different demographics?
Project Overview
Data
•The “Billionaires Statistics Dataset (2023)” was acquired from Kaggle.com
•The dataset was compiled from various sources, including Forbes and other financial publications.
•The contents of this data set include details on each of the 2,640 billionaires listed as of April 4, 2023. There are fields for the basic demographics of each person and details on their countries.
•“World-countries.json” from Kaggle.com
Tools Used

Libraries Used

Analysis
In Python:
•Conducted data cleaning by handling missing values, standardizing data formats, and removing unnecessary variables.
•Leveraged various plotting libraries to visualize distributions, trends, and correlations among variables.
•Executed geospatial analysis using Folium to analyze the geographical distribution of billionaires.
•Utilized both supervised and unsupervised machine learning algorithms to find underlying patterns and correlations in the data.
•Formulated a hypotheses. Then used linear regression models to test the hypothesis, evaluating the impact of variables on billionaire demographics.
In Tableau:
•Recreated the Python statistical analysis in Tableau, utilizing functions and tools for descriptive statistics and regression analysis.
•Developed visualizations in Tableau by leveraging the platform’s charts, graphs, and interactive features to represent data relationships.
•Crafted data narratives in Tableau, combining visualizations into a cohesive story to communicate findings.
Project Links
Project Data Analysis
Visualizing Distributions and Correlations
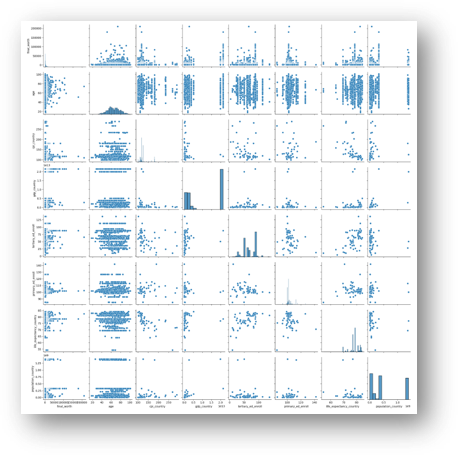
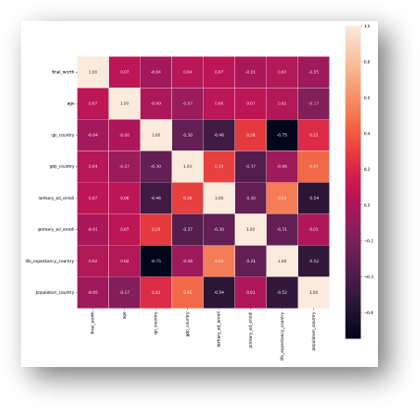
After the initial cleaning and wrangling was performed, Python plotting libraries were used to visualize distributions, trends, and correlations among variables. A pairplot and heatmap were used to find variables with high correlation.
Geospatial & Linear Regression Analysis
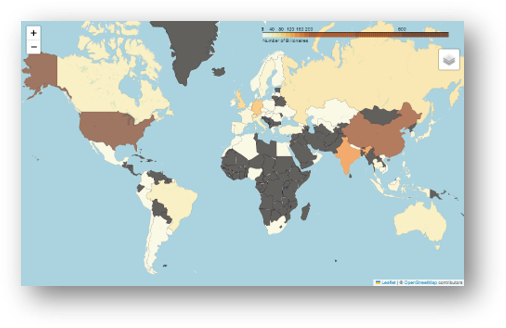
Then, geospatial analysis was performed using a JSON file in Folium to analyze the geographical distribution of billionaires.
The countries with the most billionaires are the United States (754), China (523), and India (157).
More than half of the world’s billionaires live in the United States and China.
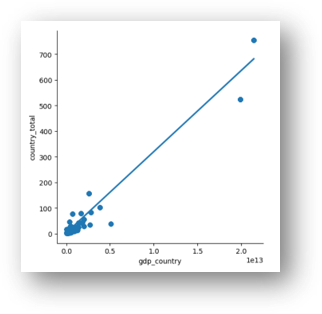
Next, multiple linear regressions were created, and a hypothesis formed.
Hypothesis: As a country’s GDP increases, so does its number of billionaires.
Machine Learning
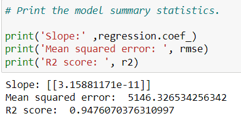
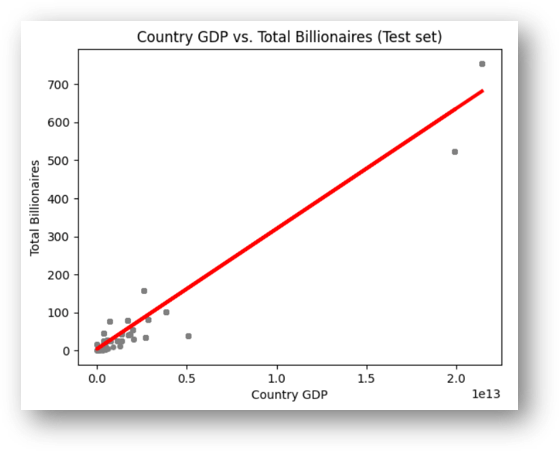
Finally, using a supervised machine learning algorithm, the hypothesis was tested.
(No additional insights were gained from unsupervised machine learning—
K-means clustering.)
We considered removing the two biggest outliers (The US and China) to see how this affected the linear relationship. However, we elected not to do this because they fit the regression line as well as the other data points, and since these two countries together have more billionaires than the rest of the countries combined, the majority of the data would have to be excluded. This could greatly distort reality.
The results showed that a country’s GDP contributes to ~95% of this trend in the data—a very strong correlation.
Demographic Trends
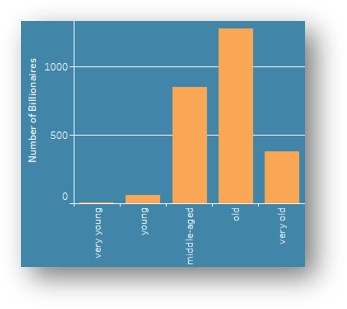
We can see that the majority of billionaires are middle-aged or old. This makes sense as the accumulation of wealth usually takes decades. The fewer billionaires in the “very old” category is likely to do mortality rates increasing with age.
very young: under 25 years
young: 25 – 39 years
middle-aged: 40 – 59 years
old: 60 – 79 years
very old: over 80 years
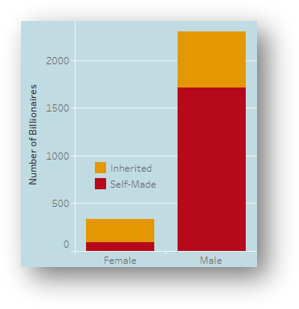
First, we can see that there are over six times more male billionaires (2,303) than there are female billionaires (337).
Second, we can see that, according to this dataset, most female billionaires inherited their wealth (~72%), whereas most male billionaires are self-made (~75%).
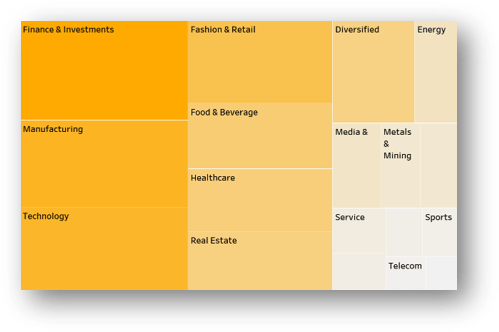
The top four industries in which billionaires make (or from which they inherit) their wealth are Finance & Investments, Manufacturing, Technology, and Fashion & Retail. These four industries combined account for nearly half (~48%) of billionaires.
Results, Limitations, and Next Steps
Results
- The factor with the highest correlation to the number of billionaires in a country is the country’s GDP.
- The majority of billionaires are between the ages of 40 and 80.
- There are many more male billionaires than female. However, the majority of male billionaires are classified as “self-made” while the majority of female billionaires are classified as having inherited their wealth.
- The top industries in which billionaires make (or inherit) their wealth are Finance & Investments, Manufacturing, Technology, and Fashion & Retail.
- Overall, these results give a picture of wealth distribution, age dynamics, gender disparities, and industry focus among billionaires, which can inform evidence-based policymaking aimed at promoting economic growth, reducing inequalities, and fostering inclusive development.
Limitations of the Analysis
- This dataset cannot answer the question of what the relationship is between a country’s GDP and its number of billionaires. Each could influence the other, and each could be influenced by other factors such as economic policies, available natural resources, financial markets, cultural norms, technological advancements, and others.
- Categories like “self-made” and “inherited” may be too limiting to accurately reflect reality. Many billionaires may have inherited a large amount of wealth and then built on it themselves to become billionaires to different degrees. Not everyone started from zero, and being lumped into only one category or the other may not reflect each situation.
Next Steps
- Collect this dataset year to year and conduct a time-series analysis.
- With yearly datasets collected, use the historical data of billionaires now deceased to analyze lifespans of billionaires compared to the average lifespans
in their countries. - Explore what factors may influence the disparity between the numbers of male and female billionaires and the gender difference between “inherited”
and “self-made” billionaires.
